Family trees are fun to trace, but with traditional family groups and pedigree charts they don't always tell the whole story. Genograms are a great way to tell your family story because with these charts you can record family relationships -- like which family members loved or hated each other -- or even your potential risk for disease.
What Are Genograms?
Genograms were initially created for use in the field of family therapy. Although, the exact creation date has not been pinned down, the term and concept was used by Dr. Murray Bowen in the late 1960s and Bowen proposed it be a replacement for the family diagram used by family therapists in the late 1970s.
Genealogy Use
Family historians, realizing the practicality of the concept, began using it as a supplement to the family pedigree and family group charts because a genogram can expand on the relationships, diseases, and religious affiliations that are often left uncovered in genealogy research. It became a way to make a family history more vibrant and alive.
How Are They Used?
In the field of genealogy, most experts advise using at least three generations when creating a genogram of a family. Since these charts provide a way to look beneath the surface of names, dates, and places, several generations are needed to allow patterns and characteristics to emerge. This creates a more complete picture of one's family tree.
Details
The charts can be as sparse or as detailed as you want, but to fully appreciate a family's unique identity, details are needed. You need to include the stories, information and relationships that are unique to your family line.
For example, when researching your family tree, you may learn that your grandmother was extremely close to her youngest sister, but distant with her older brother. With a traditional family pedigree chart there is no way to depict this information. However, with a genogram, you could connect your grandmother and her youngest sister with a triple line showing their closeness while using a dotted line to clarify her relationship with the older brother.
Subjective Interpretation
Caution should be taken however when reading or creating the chart. Because of the subjective nature of some of the traits, such as closeness, it's important to note that the genogram can present only one perception in your family history.
You can quickly tell who created the genogram since that person's symbol will contain a double line indicating they are the index. Knowing who created the chart can help you decide if the subjective interpretation is correct.
Medical
Certain diseases are hereditary as are certain physical traits and genograms are an excellent way for family members to know, at a glance, if a certain disease is rampant in their family line. For example, a symbol for heart disease (usually a heart) can be placed inside a family member's symbol and glancing at the genogram, you can quickly spot how many in a three-generation span suffered or died from heart-related illness.
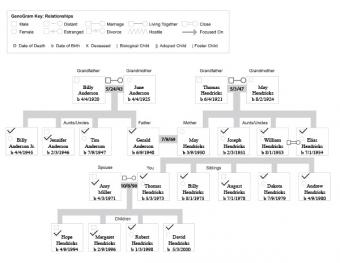
Commonly Used Symbols
The basic symbols used in genograms are easy to remember. Even so, you should include a symbol legend on the chart to prevent any misinterpretations of what any of the symbols mean. This is especially true with the more complicated genograms that record relationships.
Squares and Circles
These are the building blocks of a genogram. The square symbolizes a male and the circle, a female. If a male created the chart, their symbol is a square inside a square to create the double-line effect. Conversely, in a chart created by a female the index will be a circle inside a circle.
Lines
The second most common mark in a genogram is the line. A straight line connecting two individuals indicates a relationship. Marriage is a solid line that goes down and across to the partners with the husband on the left. While children are denoted by a straight vertical line connecting the child's square or circle to the marriage line. Children are arranged with the oldest to the left.
There are variations to the line. Dashed and dotted lines usually represent less closeness between individuals, but always read the chart's legend to ensure correct interpretation.
Slashes
Slashes are used to denote a break in a relationship. A single slash signifies separation while a double slash indicates divorce. Usually the date of the divorce or separation is included near the slash marks.
Special Marks
These can be as varied as the genogram chart creator chooses, but some common ones are:
- Vertical dotted lines are often used to denote an adopted child.
- Small triangles can signify a pregnancy while a small x connected to a female can indicate an abortion.
- Small, filled-in circles that are vertically attached to the marriage line usually denotes a miscarriage.
What Information Should You Chart?
The key to a useful genogram is always in the details. Before starting your genogram, gather as much information as possible about three or more generations. You need information like dates for births, deaths, marriages, divorces and family names for everyone in the three-generation span. It is also helpful to record beforehand any known family diseases or family relationships.
In your chart, you can trace whatever you find informative or interesting, but some common items to record are:
- Education level
- Community service
- Religious affiliation
- Occupation
- Musical aptitude
Several programs exist to simplify creating your genogram. Here are three:
- Genopro: This software lets you "display a complete graphical representation of your genealogy tree." You can include images in the chart and you have considerable flexibility in how you create your family tree.
- Family Health Portrait: This U.S. government website lets you create a family medical and race genogram for free. You can input diseases present in your direct family line to keep an ongoing medical record for reference.
- Genogram Analytics: This software program includes predesigned symbols and relationship lines which can remove quite a bit of the mundane work of genogram creation.
Multiple Charts
Since a chart with too many variables becomes very difficult to read, consider a couple of approaches to capture all the information. First, break out your family in 3-generation segments on both the maternal and paternal side so that a chart becomes very specific with regards to the individuals tracked. Secondly, create several charts for each of these segments.
By creating multiple charts per segment, you can then cross-examine the information across generational lines, creating a more complete picture of your family tree.


